
Turbofan Engine Remaining Useful Life Prediction
LSTM-Based Predictive Maintenance Using NASA C-MAPSS
Project links: Repository | Data information | Source code | README
Abstract
This project estimates the remaining useful life (RUL) of simulated turbofan engines from NASA C-MAPSS FD001 sensor trajectories. A stacked LSTM performs time-series regression on 50-cycle windows of 14 sensor channels. Re-evaluation of the saved model with an explicitly reconstructed training-only scaler gives RMSE 13.8726 cycles and MAE 10.2374 cycles over 93 eligible test engines. Seven shorter trajectories are excluded. The original scaler is absent, so this is a documented reconstruction rather than complete recovery of the historical experiment. Validation overlap, target timing and limited simulation coverage constrain interpretation; the FastAPI interface is a research prototype.
1. Introduction
Predictive maintenance uses changes in operating measurements to estimate when equipment may reach an end-of-life criterion. In this report, RUL is the number of operating cycles remaining before simulated failure. Run-to-failure training trajectories provide a retrospective target; test trajectories stop before failure.
A single sensor snapshot can be noisy and ambiguous. LSTM states can represent changes across successive cycles, allowing a regression model to use temporal context. This repository demonstrates that approach; it does not establish maintenance decision thresholds or safety certification.
2. NASA C-MAPSS Dataset
All four C-MAPSS subsets are stored in data/raw/. The loader defaults to FD001, and both training and evaluation use that default. Direct inspection confirms 100 training engines (20,631 rows), 100 test engines (13,096 rows), and 100 endpoint RUL labels. NASA identifies FD001 as one sea-level operating condition with one fault mode: high-pressure compressor (HPC) degradation.
NASA dataset description and subset definitions.
| Parameter | Value |
|---|---|
| Subset | FD001 |
| Training / test engines | 100 / 100 |
| Training / test observations | 20,631 / 13,096 |
| Operating conditions | 1 (sea level) |
| Fault modes | 1 (HPC degradation) |
| Raw columns | 26: engine ID, cycle, 3 settings, 21 sensors |
| Model inputs | 14 sensors; settings, ID and cycle excluded |
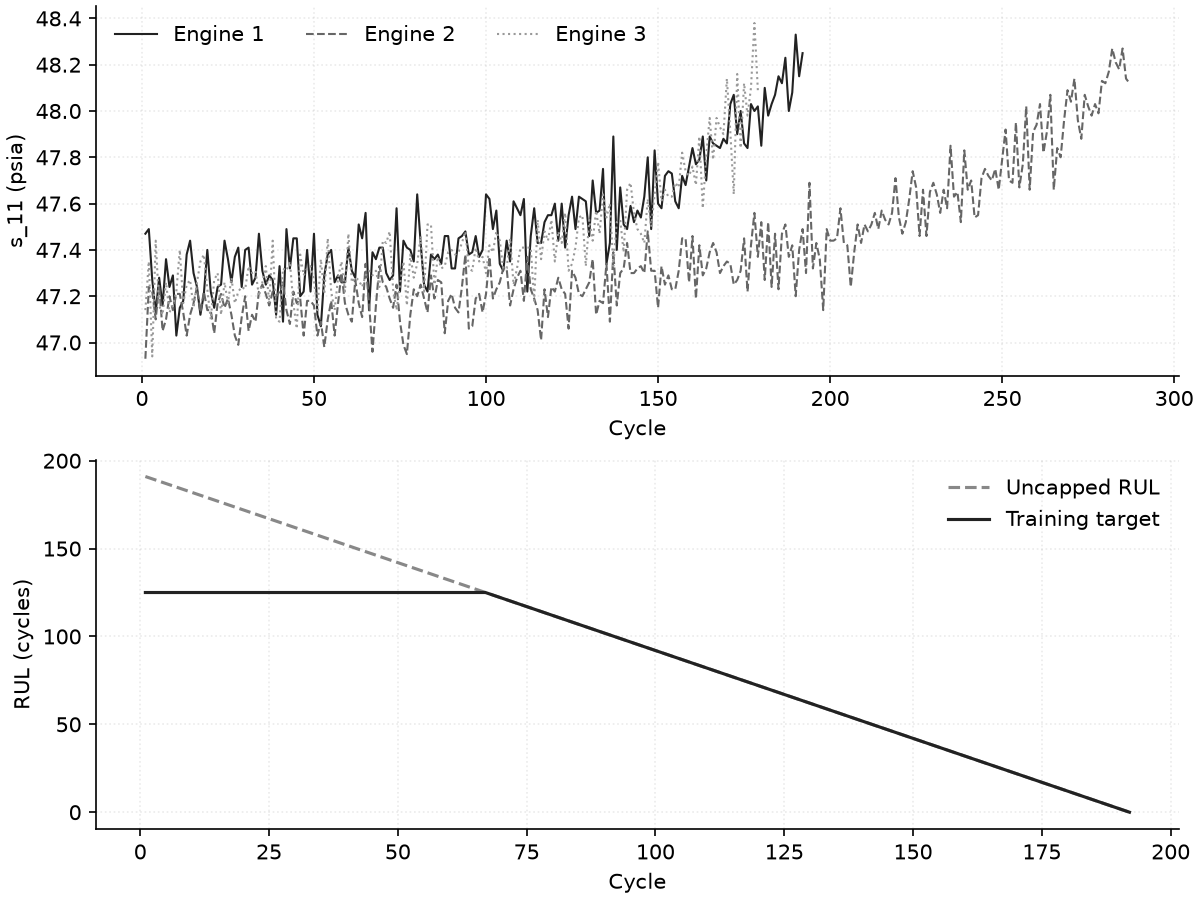
| Training target | min(final cycle − target cycle, 125) |
| Evaluation target | Unclipped NASA RUL at test endpoint |
3. Experimental / Simulation Background
Simulation and engine configuration
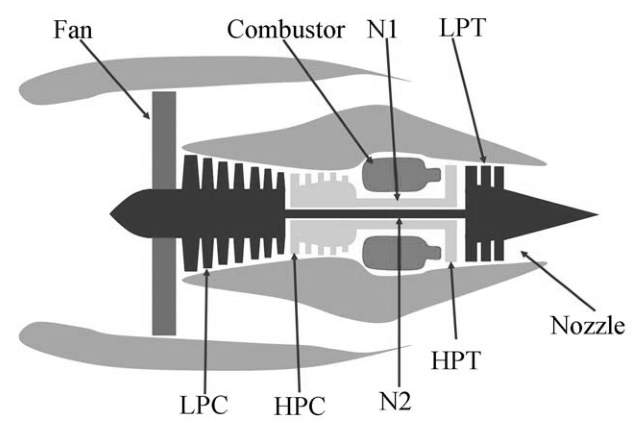
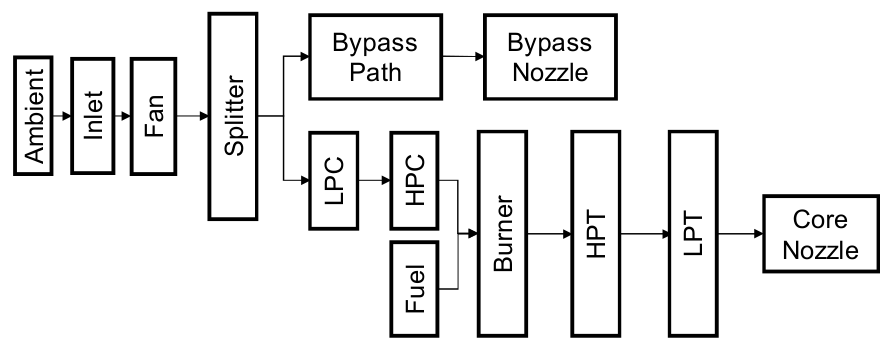
C-MAPSS means Commercial Modular Aero-Propulsion System Simulation. The historical study uses an engine simulation in which component flow and efficiency changes represent progressive damage. Sensor outputs follow the simulated engine response. These data are not measurements from a physical engine experiment conducted by the project author.
4. Data Processing
Raw trajectories → fixed sensor selection → training-fitted MinMax scaling → per-engine sliding windows → LSTM input. No smoothing is applied in the executable training, evaluation or API pipeline.
Retained, in model order: s_2, s_3, s_4, s_7, s_8, s_9, s_11, s_12, s_13, s_14, s_15, s_17, s_20, s_21.
Removed: s_1, s_5, s_6, s_10, s_16, s_18, s_19. The exploratory notebook selects these using standard deviation < 0.01, despite calling the quantity “variance”. Production preprocessing uses a fixed list, not a fitted variance selector. Notebook 2 illustrates moving averages of 5 and 50 cycles; neither is used by the saved-model pipeline.
MinMaxScaler is fitted on all FD001 training rows and then applied unchanged to test data. Training values map to [0, 1]; test or API values may fall outside that interval. Engine ID and cycle are retained for grouping but are not neural-network features. No test labels are used to fit the scaler.
Each engine contributes N − 50 windows, giving 15,631 training samples. The slice [start:start+50] is paired with RUL at index start+50: one cycle after the final input row. Evaluation instead compares the last 50 observations with RUL at their endpoint. This one-cycle mismatch is preserved and disclosed, not silently corrected for the existing model.
5. LSTM Methodology
The model definition and the saved HDF5 configuration agree. The network contains 124,275 trainable parameters. LSTM activations are tanh with sigmoid recurrent gates; recurrent dropout and explicit weight regularizers are absent.
| Layer | Configuration | Output shape |
|---|---|---|
| Input | 50 cycles × 14 sensors | (50, 14) |
| LSTM 1 | 128 units; return_sequences=True | (50, 128) |
| Dropout | 0.2 | (50, 128) |
| LSTM 2 | 64 units; return_sequences=False | (64) |
| Dropout | 0.2 | (64) |
| Dense | 25 units; ReLU | (25) |
| Dense output | 1 unit; linear | (1) |
Training uses Adam (initial learning rate 0.001), mean squared error loss, batch size 64 and at most 100 epochs. The final 20% of ordered windows form the validation partition; training-window shuffling uses the Keras default. Callbacks save the lowest validation-loss model, stop after 10 unimproved epochs and halve the learning rate after 3. No random seed is set.
The committed log records 25 epochs (indices 0–24). Minimum validation MSE is 148.4639 at epoch index 14; corresponding validation MAE is 9.4155 cycles. These are validation statistics, not test results. The log alone does not prove full training provenance.
6. Model Evaluation
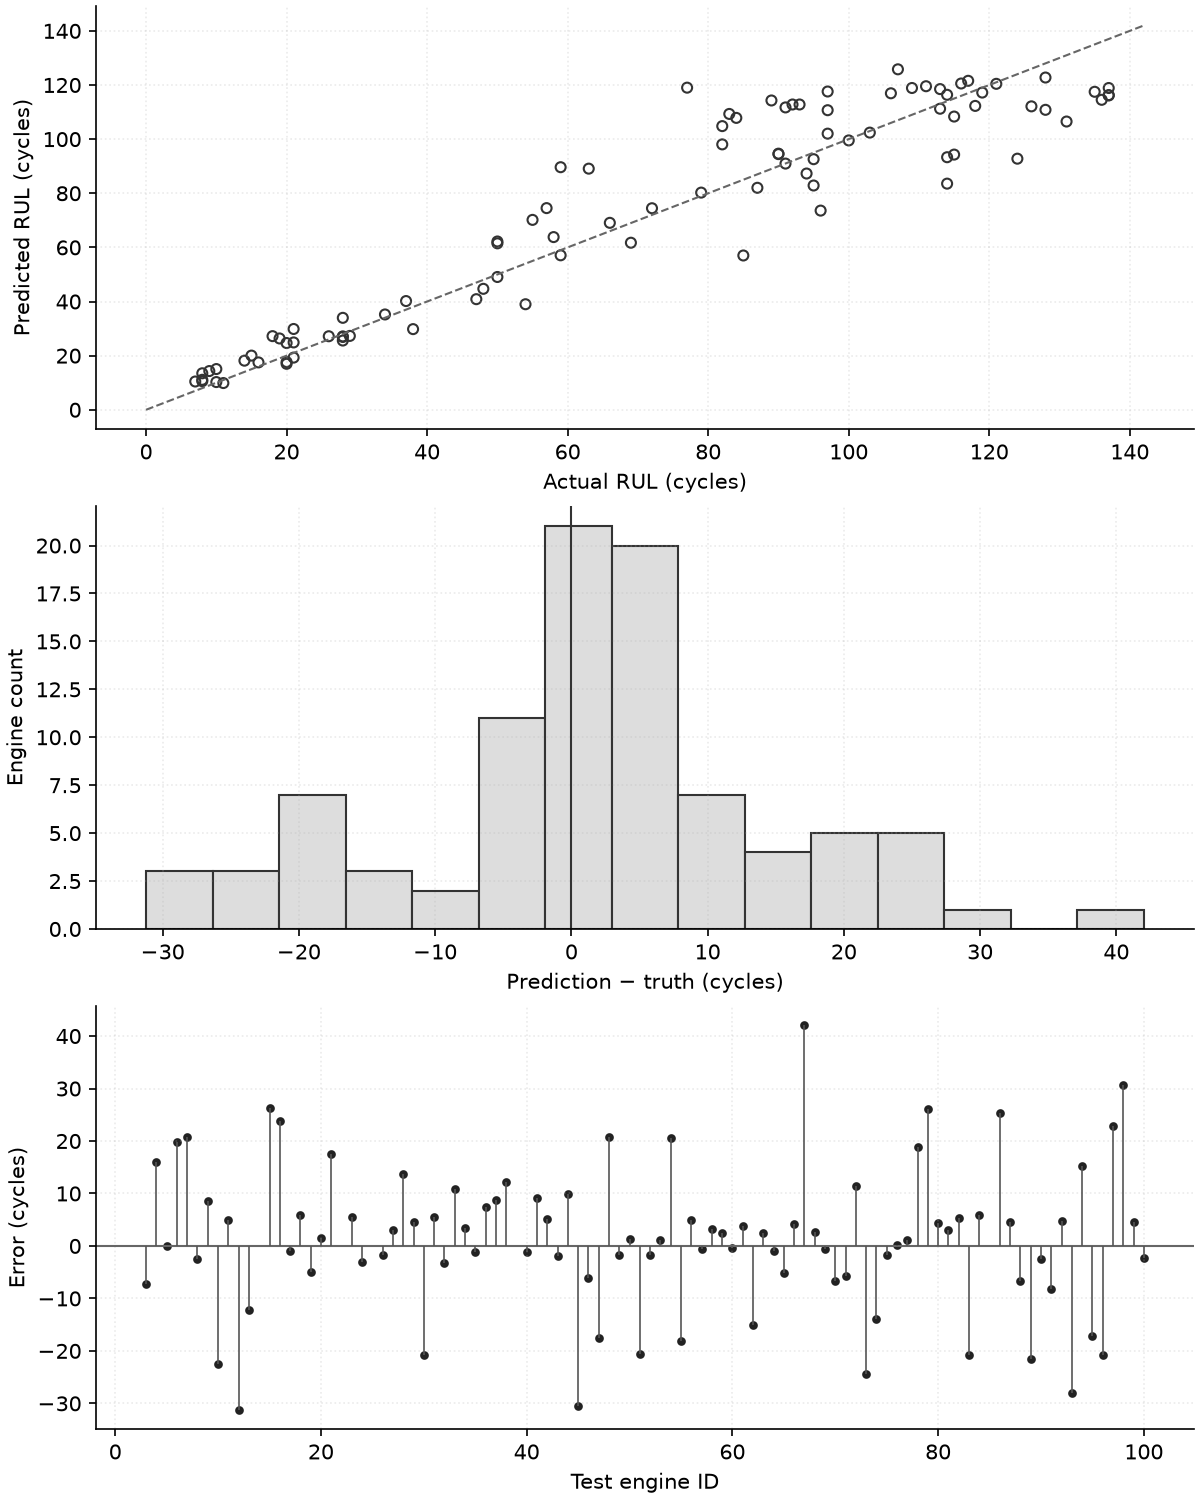
Evaluation takes one final 50-cycle window per eligible test engine, keeping engine IDs when joining RUL_FD001.txt (row engine_id − 1). Engines 1, 2, 14, 22, 25, 39 and 85 have fewer than 50 observations and are excluded: coverage is 93/100, without padding. Test targets and predictions are not clipped.
The repository does not include scaler.pkl. The reported re-evaluation explicitly reconstructs MinMaxScaler from all 20,631 FD001 training rows, matching the current code recipe. The saved model is loaded with compile=False; no fitting or retraining of network weights occurs. This verifies the reconstruction, not the identity of the missing historical scaler.
| Evidence | RMSE | MAE | Scope |
|---|---|---|---|
| Saved-model re-evaluation | 13.8726 | 10.2374 | 93 engines; reconstructed scaler |
| Original plot / README | 13.87 | 10.24 | Plot records RMSE only; README MAE lacks archived numeric evidence |
RMSE = √mean((prediction − truth)²); MAE = mean(|prediction − truth|). Both measure regression error in cycles. No regression “accuracy”, PHM score, uncertainty interval or repeated-run distribution is reported.
Machine-readable metrics and artifact hashes | Per-engine predictions (CSV)
7. Prediction Results
The following figures are computed from the saved-model re-evaluation and committed raw data. Each test point represents a different engine; a line connecting these engines would not be a single degradation trajectory. Positive residuals mean the model overestimates remaining life.
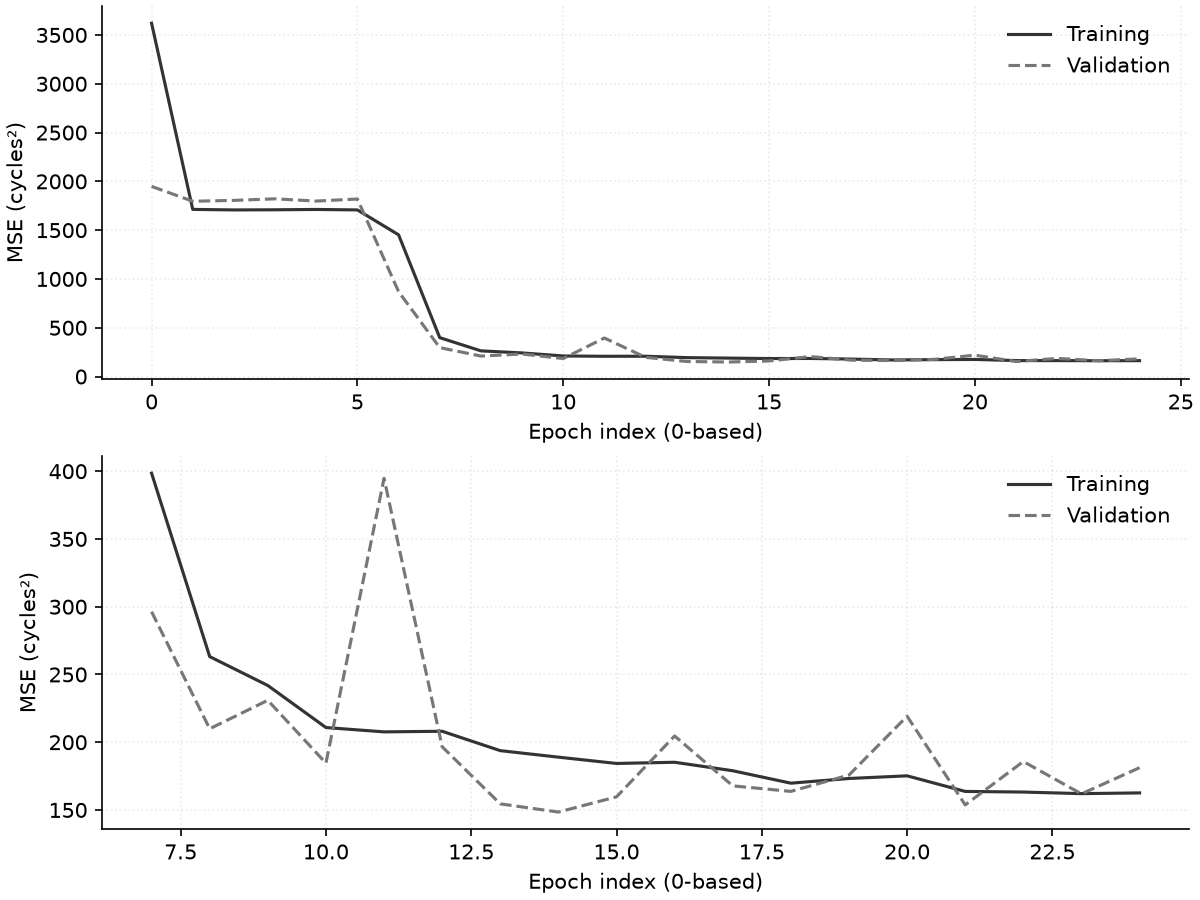
Original evaluation plot (unaltered archive) · Original training log
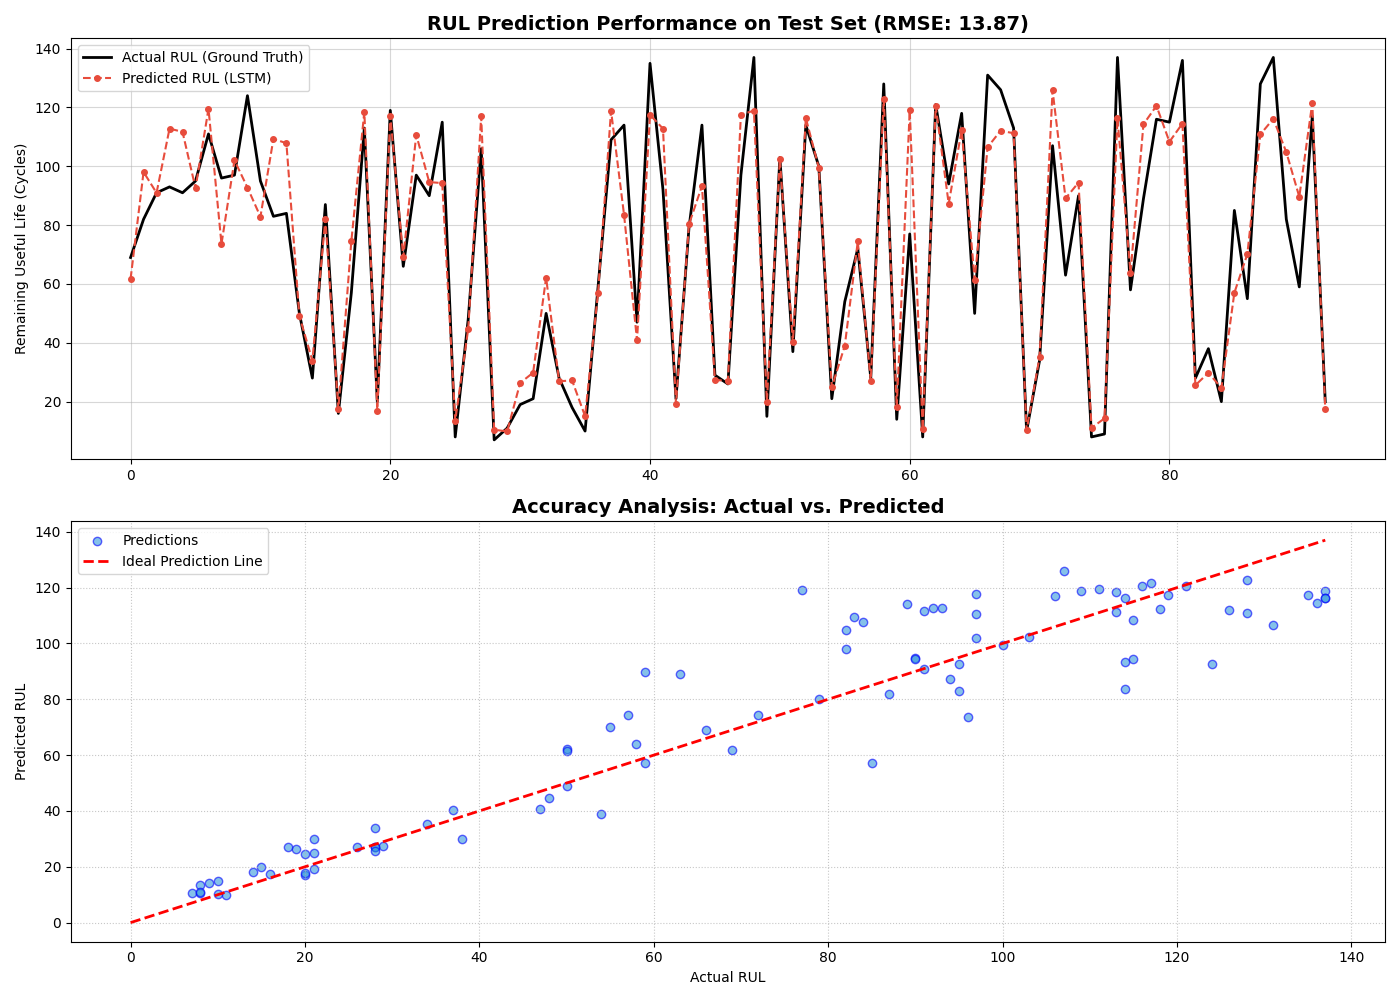
The archived plot carries RMSE 13.87 and uses the label “Accuracy Analysis”; that wording is retained only inside the original image. Its horizontal index enumerates eligible engines, not cycles. It does not substantiate evaluation on all 100 engines or the README’s MAE 10.24.
8. Predictive Maintenance API
FastAPI loads the Keras model and scaler once in its lifespan manager. POST /predict accepts a JSON object with a data list of at least 50 rows. Every row requires the 14 named sensor fields as numeric values. Supply raw readings in chronological order from one engine; the endpoint uses the last 50 rows, orders sensor columns, scales them and predicts one RUL value.
This GitHub Pages report is static. It does not load the model, contact an inference service or calculate a prediction. The example below documents the local API only. The missing scaler must be restored or explicitly reconstructed before serving predictions.
GET / returns service information; /docs provides Swagger UI on the running API server. Request-schema errors return 422, fewer than 50 rows return 400, and missing model/scaler returns 503. The original broad exception handler changed intentional errors into 500; this has been repaired. The API does not verify engine identity, sampling intervals, physical ranges or uncertainty.
9. Project Architecture
Turbofan-RUL-Prediction-LSTM/
├── api/
│   ├── main.py
│   └── test-api.py
├── data/raw/
├── models/
│   ├── saved_models/best_model_v1.h5
│   ├── training_log.csv
│   ├── training_plot.png
│   └── test_result_plot.png
├── notebooks/
├── src/
│   ├── data_loader.py
│   ├── preprocessing.py
│   └── model_def.py
├── train.py
├── evaluate.py
├── tests/
├── scripts/
└── docs/
src/ separates ingestion and target construction, preprocessing and sequence generation, and model definition. train.py manages optimization and checkpoints; evaluate.py loads the saved network and exports audit evidence. api/ serves inference separately. notebooks/ contains exploration, while docs/ contains this static report and its evidence.
10. Limitations and Future Work
- FD001 only: one operating condition and one degradation mode. The presence of FD002–FD004 files does not imply evaluation on them. No external fleet validation is recorded.
- Validation leakage risk: scaling is fitted before the validation split, so validation-engine extrema influence training normalization. Ordered window splitting crosses engine 83; neighboring training and validation windows share 49 of 50 observations. Test rows are not used to fit this scaler.
- Target assumptions: training RUL is capped at 125 and shifted one cycle beyond each input window, while evaluation truth is uncapped and aligned to the endpoint. Short test histories are excluded. Comparisons require the same protocol.
- Reproducibility: the original scaler, environment lock and random seed are absent. The README’s claimed benchmark advantage and production deployment are unsupported. Confidence intervals, uncertainty calibration and repeated training runs are not implemented.
- Future work: split by engine before fitting preprocessing, align target timing, define handling for short histories, persist preprocessing with model metadata, and test broader conditions. Uncertainty estimation, domain adaptation and a hardened API remain proposals, not reported results.
11. References and Resources
- NASA Prognostics Center of Excellence Data Set Repository.
- A. Saxena and K. Goebel (2008). Turbofan Engine Degradation Simulation Data Set. NASA Ames Prognostics Data Repository. NASA Open Data: C-MAPSS description.
- A. Saxena, K. Goebel, D. Simon and N. Eklund (2008). Damage Propagation Modeling for Aircraft Engine Run-to-Failure Simulation. PHM 2008. NASA NTRS record (alternate title).
- Project repository and README; exploratory notebooks.
- Repository analysis and discrepancies; evaluation evidence; validation record.
- Figure sources and reproduction notes; GitHub Pages deployment instructions.
Source titles and historical figure labels retain their original language. The technical audit, deployment notes and machine-readable evidence are supplied in English. NASA attribution does not imply endorsement or affiliation.